send link to app
Aggregator app for iPhone and iPad
4.4 (
6944 ratings )
Utilities
Productivity
Developer: Satish Mahalingam
1.99 USD
Current version: 2.4.2, last update: 5 years agoFirst release : 19 Nov 2013
App size: 3.5 Mb
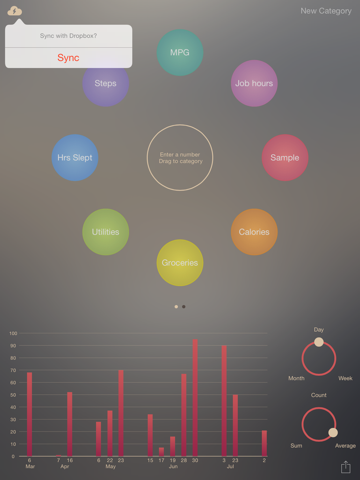
The fastest way to visualize all the disparate numbers around you:
- Daily blood sugar level
- Total distance run this week
- Average monthly spend on groceries
- Number of times you did physical therapy this month
For any measurable number, simply enter the number and drag it into a category circle. The app will automatically capture the time and date of entry, and generate graphs so you can observe trends over time using basic statistics: average, count and sum.
- iPhone and iPad
- Built in calculator. Just type in your calculation (for example: 3*2/7) and it will do the math for you
- AirDrop or E-Mail your data to other Aggregator users


